Here is the latest market commentary from our research department. If you have any questions or if I can be a resource for you in any way please feel free to email me at cyril.white@fourfinancial.com or call (734) 272-4322!
It’s a tradition here to write about what scares us around Halloween each year. The past few years have offered plenty of material to use in these annual commentaries, but with wars in Israel and Ukraine ongoing, Washington, D.C. dysfunction reaching new heights, the unrelenting rise in interest rates, still-high inflation, unaffordable housing, tight financial conditions, and a Federal Reserve (Fed) that has not yet signaled it’s done hiking rates, the list seems to be a bit longer and scarier than it usually is. But these are risk factors, not our base case. Keep in mind there are plenty of positives at the same time, including easing inflation, the resilient economy bolstered by a healthy job market, growing earnings, and the strong possibility that the Fed is done hiking rates.
Scary geopolitical landscape
Despite the intense diplomatic efforts to contain the conflict between Hamas and Israel, fears that a wider conflict would add to the tragic loss of lives and disrupt the energy markets have become more widespread. Recently, the U.S. military attacked two Syrian facilities linked to Iranian militias, following Syrian-led strikes on U.S. troops. Defense Secretary Lloyd Austin made it clear that “If attacks by Iran’s proxies against U.S. forces continue, we will not hesitate to take further necessary measures to protect our people.” Israel stepped up its attacks on Hamas in Gaza over the weekend, but the odds the conflict widens do not appear to have increased meaningfully.
Elsewhere, the Russia-Ukraine war continues while it is possible China might take advantage of the U.S. being preoccupied with the Middle East as a reason to pursue more aggression toward Taiwan. Bottom line, the current geopolitical landscape is as dangerous as it has been in decades, and the risk of a spike in oil prices has increased.
Government dysfunction and rising debt service costs
A mid-November shutdown remains likely. If Congress cannot reach an agreement on funding, the government will be forced to shut down. By now, the country—and U.S. creditors—are used to the drama that envelopes markets during these budget impasses. The need to keep federal operations functioning is particularly crucial, as funding for defense spending is (unfortunately) essential at this time.
Moreover, the average American continues to worry that another government shutdown could lead to benefit payments being halted, despite payments continuing to be paid on time during previous government closures.
The road to getting the U.S. debt problem under control will be long and tough. Though more of a long-term scare, a functioning government will be critical in coming years as federal debt service costs increase. The government’s net interest cost as a percent of tax revenue bottomed below 7% in 2015 before doubling since then to more than 14% currently, a level that has sparked austerity in the past. Meanwhile, the 3.02% average interest rate on U.S. Treasuries currently is poised to increase dramatically in coming years—the rate exceeded 6% in 2001. Entitlement reform will be hard to do but, along with (unfortunate) tax increases, will be critical to avoid a painful debt crisis in the future.
S&P 500 technical breakdown
The S&P 500’s losses last week dragged the index below its 200-day moving average (dma) for the first time since March of this year. A break below this widely-followed technical measure of momentum can scare investors because any outsized decline—following the laws of math—has to follow one of these breakdowns. So, while this development is worrisome, we would note that historically, stock market performance after breaks below the 200-dma tend to be okay as stocks usually bounce after becoming oversold. The S&P 500’s break below this level in March offers a good example as the index rallied more than 19% from March 31 through July 31 following this technical breakdown (Figure 1).
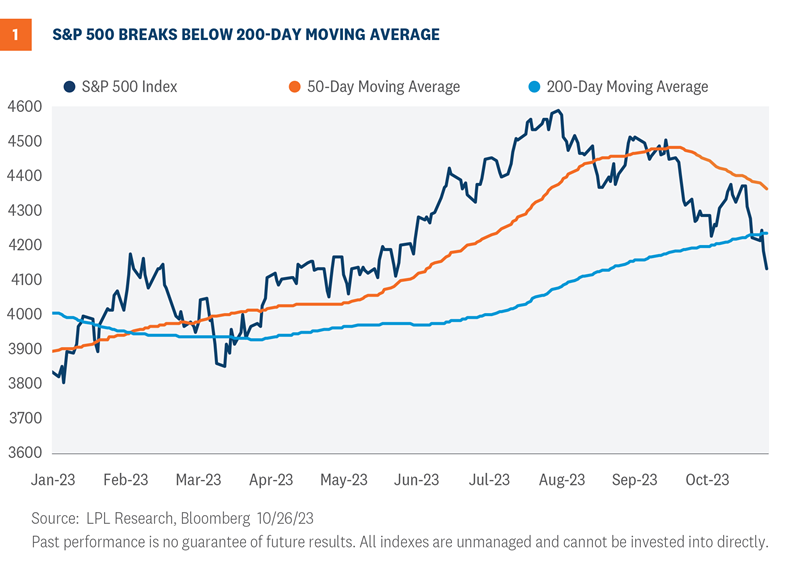
Looking back at history, the S&P 500 has crossed below its 200-day moving average (dma) 219 times since 1950. Forward three, six, and 12-month returns following each crossover averaged 2.8%, 4.4%, and 7.0%, respectively, hardly worrisome, while stocks traded higher two-thirds of the time 12 months after the index violated its 200-dma.
While these statistics may appear counterintuitive, a break below the 200-dma often implies investors have likely already discounted a large degree of downside risk. It is also important to remember the market’s long-term tendency to advance over time (the S&P has only spent 29% of trading days below the 200-dma since 1950). Finally, with the index more than two standard deviations below its 50-dma, the market is oversold and may be due for a bounce.
Rising rates
Rising rates remain perhaps the biggest challenge facing both equity and bond markets currently. Surging bond yields have contributed to one of the worst two-year periods for bond market performance in history and have pressured stock valuations at the same time. The Bloomberg Aggregate Bond Index has lost 15% over the past two years while the forward (next 12 months) price-to-earnings ratio for the S&P 500 has fallen from near 22 in early 2022 down to 17.5 currently.
While our forecast for the 10-year yield implies sub-4.75% rates at year-end, several dynamics are worrisome and could push rates over 5% in the near term, including the supply-demand imbalance that has emerged in the Treasury market and potential re-acceleration in inflation. We show the unrelenting move higher in rates in Figure 2.
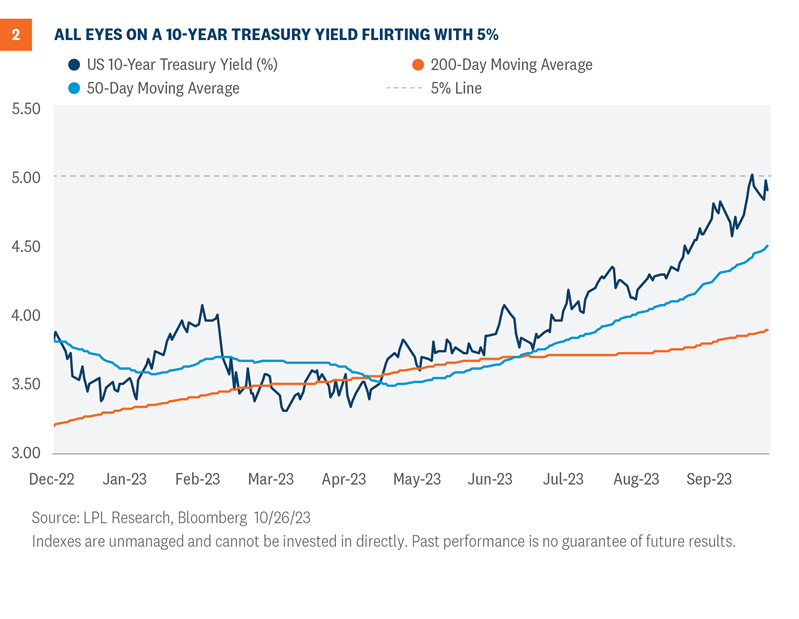
Treasuries need buyers at a difficult time. The Treasury market needs buyers given the supply-demand imbalance that has emerged. If demand is insufficient at current rates, then the market response will inevitably be higher rates to entice buyers. With budget deficits expected to stay in the 6–8% range for the next few years in terms of percent of gross domestic product, the Treasury Department will have to issue a lot of debt to fill the budget gap.
The increase in issuance to fund the federal deficit comes at a time when the most price-insensitive buyers, i.e. the Fed and other major global central banks, are reducing their Treasury exposure. Meanwhile, household investors, pension funds, and hedge funds (historically only about 20% of buyers) are needed to shoulder the additional load, but given other investment options, Treasury yields may need to keep increasing to attract those investors. A possible move in the 10-year above 5% could be an indication that this level is insufficient to bring in more buyers amid “buyers’ fatigue.”
Watch for a possible re-acceleration in inflation. Though not our base case, as we saw in the 1970s, it is possible markets get spooked by a re-acceleration in inflation at some point, possibly driven by a pronounced and significant shock to oil markets as a result of rising geopolitical tensions. If the economy remains too strong and too much money is sloshing around in the system, inflation expectations could rise again, introducing more potential rate hikes from the Fed and pushing intermediate and longer term yields higher. Those higher rates could make it more difficult for companies to refinance maturing debt in the next year and put more pressure on commercial real estate markets.
Monetary policy is tighter than meets the eye
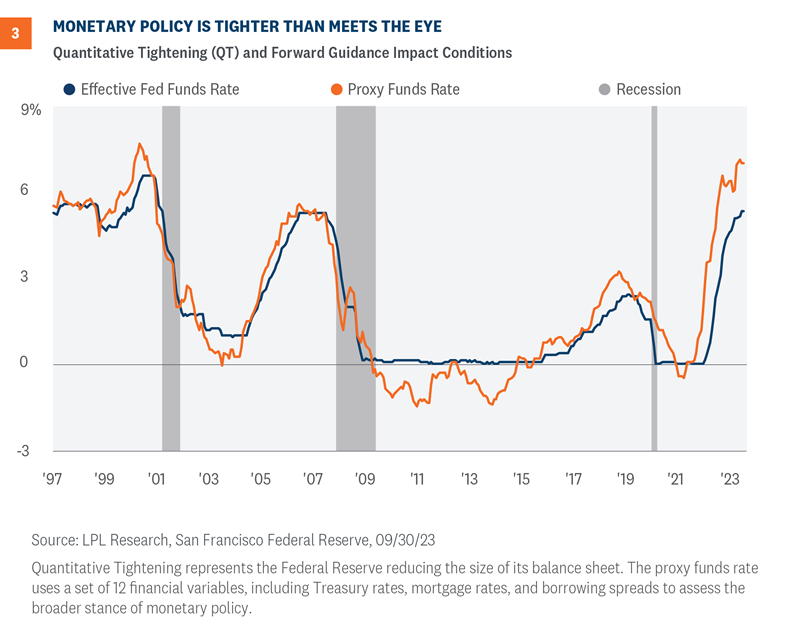
We know the Fed has embarked on one of the most aggressive rate hiking campaigns in history. But what you may not know is that monetary policy may be tighter than most investors realize.
The San Francisco Fed created a proxy to the effective federal funds rate, shown in Figure 3. This proxy rate includes other market actions in addition to the target rate set by the Fed. Why should investors care about this? Because this proxy rate illustrates how the markets are impacted by what the Fed is doing. Currently, the Fed’s balance sheet management and its forward guidance are adding additional tightening through financial conditions, so this proxy rate provides investors a more complete measure of the magnitude of additional impacts on markets.
As of last month, the Fed’s policy actions had tightened financial conditions more than meets the eye, which may explain some of the choppiness we see in markets, on top of rising geopolitical tensions, interest rate fears, and some high-profile third quarter earnings disappointments.
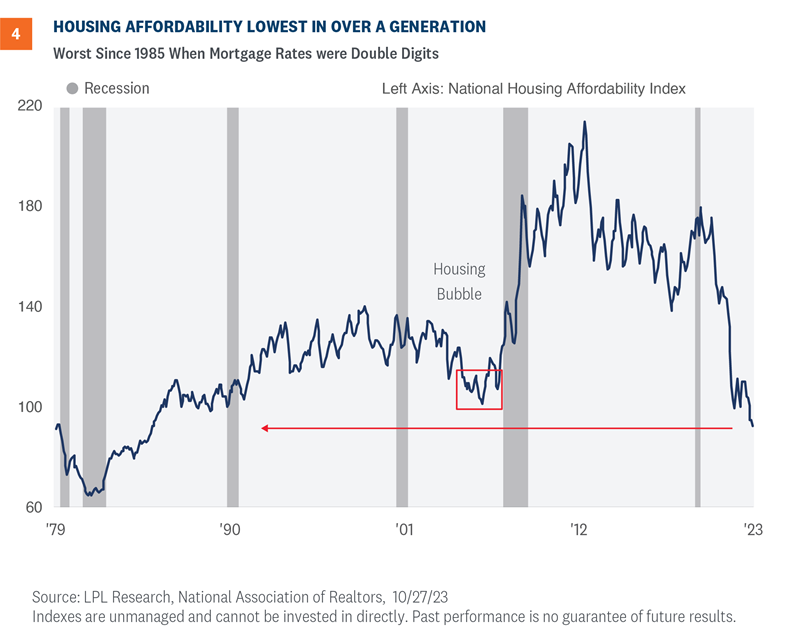
Housing affordability at multi-generational low
In this important chart (Figure 4), we see housing affordability is now the lowest since 1985 when mortgage rates were double digits. This affordability metric takes into account median home prices, household income, and the prevailing mortgage rate, and so in this case, affordability captures the uniqueness of each period. For example, in the current environment, home prices have not moderated much despite high borrowing costs because housing inventory is so low. Those who refinanced in recent years to amazingly low fixed rates have what we would call “golden handcuffs”, keeping them content in their current homes and providing a strong disincentive to move.
Investment conclusion
The market climbs a wall of worry so there is always something to scare investors. Today investors may feel like that wall is unusually tall, given stiffening headwinds facing the economy, including the effects of rising rates, and two wars overseas as the S&P 500 enters correction territory (down 10% from its recent high). We expect the strong job market, cooling inflation, the end of Fed rate hikes, stable interest rates, and growing corporate profits to help stocks overcome these worries and keep this young bull market going. And we believe the macroeconomic environment and seasonal tailwinds will provide enough support for stocks to move modestly higher over the balance of the year, though the path may be bumpy.
Latest thinking on asset allocation
LPL’s Strategic and Tactical Asset Allocation Committee (STAAC) recommends a neutral tactical allocation to equities, with a modest overweight to fixed income funded from cash. The risk-reward trade-off between stocks and bonds looks relatively balanced to us, with core bonds providing a yield advantage over cash.
The STAAC recommends being neutral on style, favors large caps over small, and maintains energy and industrials as top sector picks. Our regional preference has shifted to the U.S. over developed international equities due to weakening economic conditions in Europe, while emerging markets remain underweight.
Within fixed income, the STAAC recommends an up-in-quality approach with benchmark-level interest rate sensitivity. We think core bond sectors (U.S. Treasuries, agency mortgage-backed securities (MBS), and short-maturity investment grade corporates) are currently more attractive than plus sectors (high-yield bonds and non-U.S. sectors) with the exception of preferred securities, which continue to look attractively valued.
Jeffrey Buchbinder, CFA, Chief Equity Strategist
Lawrence Gillum, CFA, Chief Fixed Income Strategist
Quincy Krosby, PhD, Chief Global Strategist
Jeffrey Roach, PhD, Chief Economist
IMPORTANT DISCLOSURES
This material is for general information only and is not intended to provide specific advice or recommendations for any individual. There is no assurance that the views or strategies discussed are suitable for all investors or will yield positive outcomes. Investing involves risks including possible loss of principal. Any economic forecasts set forth may not develop as predicted and are subject to change.
References to markets, asset classes, and sectors are generally regarding the corresponding market index. Indexes are unmanaged statistical composites and cannot be invested into directly. Index performance is not indicative of the performance of any investment and do not reflect fees, expenses, or sales charges. All performance referenced is historical and is no guarantee of future results.
Any company names noted herein are for educational purposes only and not an indication of trading intent or a solicitation of their products or services. LPL Financial doesn’t provide research on individual equities.
All information is believed to be from reliable sources; however, LPL Financial makes no representation as to its completeness or accuracy.
US Treasuries may be considered “safe haven” investments but do carry some degree of risk including interest rate, credit, and market risk. Bonds are subject to market and interest rate risk if sold prior to maturity. Bond values will decline as interest rates rise and bonds are subject to availability and change in price.
Preferred stock dividends are paid at the discretion of the issuing company. Preferred stocks are subject to interest rate and credit risk. As interest rates rise, the price of the preferred falls (and vice versa). They may be subject to a call feature with changing interest rates or credit ratings.
The Standard & Poor’s 500 Index (S&P500) is a capitalization-weighted index of 500 stocks designed to measure performance of the broad domestic economy through changes in the aggregate market value of 500 stocks representing all major industries.
The PE ratio (price-to-earnings ratio) is a measure of the price paid for a share relative to the annual net income or profit earned by the firm per share. It is a financial ratio used for valuation: a higher PE ratio means that investors are paying more for each unit of net income, so the stock is more expensive compared to one with lower PE ratio.
Earnings per share (EPS) is the portion of a company’s profit allocated to each outstanding share of common stock. EPS serves as an indicator of a company’s profitability. Earnings per share is generally considered to be the single most important variable in determining a share’s price. It is also a major component used to calculate the price-to-earnings valuation ratio.
All index data from FactSet.
Value investments can perform differently from the market as a whole. They can remain undervalued by the market for long periods of time.
The prices of small cap stocks are generally more volatile than large cap stocks.
International investing involves special risks such as currency fluctuation and political instability and may not be suitable for all investors. These risks are often heightened for investments in emerging markets.
LPL Financial does not provide investment banking services and does not engage in initial public offerings or merger and acquisition activities.
For a list of descriptions of the indexes and economic terms referenced in this publication, please visit our website at lplresearch.com/definitions.
This research material has been prepared by LPL Financial LLC.
Securities and advisory services offered through LPL Financial (LPL), a registered inv estment advisor and broker -dealer (member FINRA/SIPC). Insurance products are offered through LPL or its licensed affiliates. To the extent you are receiving investment a dvice from a separately registered independent investment advisor that is not an LPL affiliate, please note LPL makes no representation with respect to such entity.
| Not Insured by FDIC/NCUA or Any Other Government Agency | Not Bank/Credit Union Guaranteed | Not Bank/Credit Union Deposits or Obligations | May Lose Value |
- Get link
- X
- Other Apps
- Get link
- X
- Other Apps
Comments